Request and Offer in Public Transport System
In the mobility setting of Maputo area, measuring mobility through GPS data can have a two-side effect. On one side, local transport authorities can use the analysis results to better map and optimize the offer of public transport system. On the other side, citizens can also access to more informative description of the public transport system. Building origin-destination matrices is a first step towards the measurement and the understanding of the phenomenon.
Objectives
In the context of mobility, an accurate census data with high sample coverage could not be enough for the analysis of a dynamic phenomenon such as urban mobility. To map citizens’ movement with GPS traces, we create a set of origin-destination matrices describing the hourly fluxes between morphological areas within the city. Origin-destination matrices are a standard data format for the analysis of urban mobility and they are usually acquired by surveys combined with physical models. In recent years, the usage of GPS traces to build origin-destination matrices has become more and more common in the literature. Given a set of origin-destination matrices, the analysis can focus on: •Finding attracting areas in different time of the day; •Finding isolated areas in different time of the day. These two outputs can help decision making in consciously improving the offer based on the real-time measured demands.
Activities
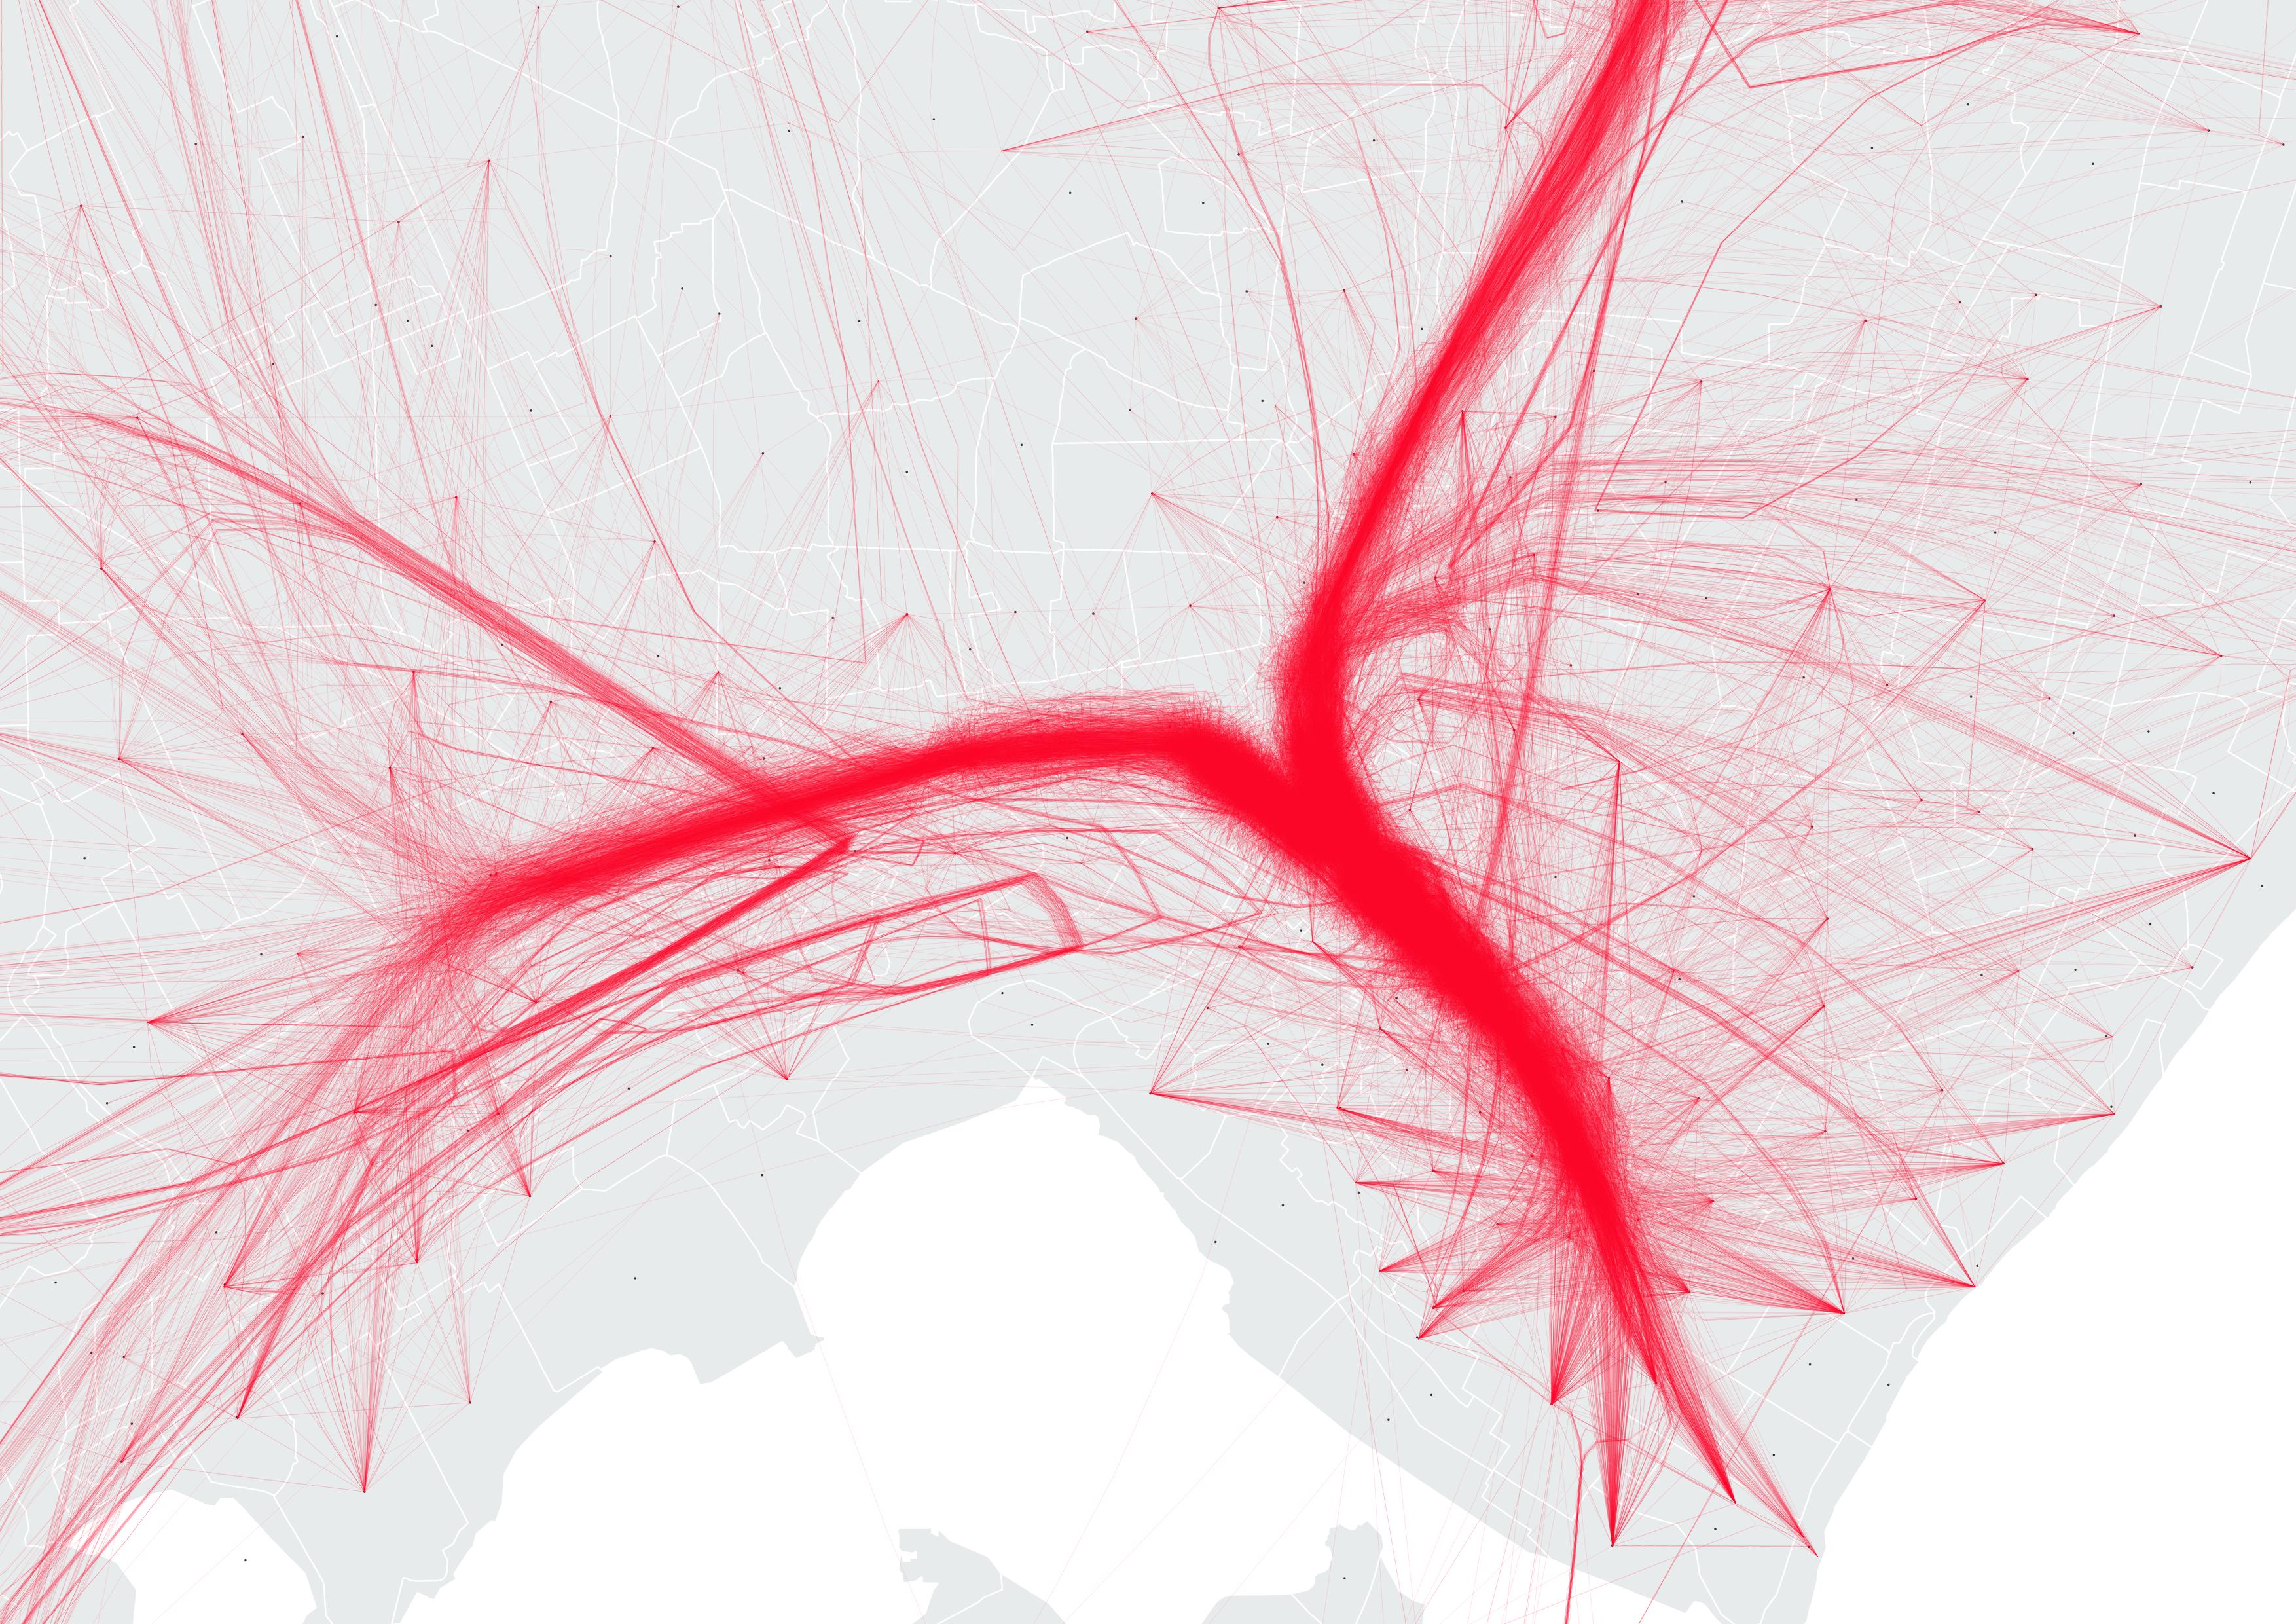
Trajectories building
Given a set of GPS localization in time, the first step is to identify if a localization belongs to a trajectory or if it is a stationary point. To do so, the difference in time and space between observation is computed, setting a threshold to define moving and stopping points. Among the stopping points, some of them represent the end of a trajectories while others represent a waiting point (e.g., a traffic light, a bus stop). To discern between these two different stationary points, a spatio-temporal criterion has been applied. The city has been divided in different areas. In some areas, the stopping point with a time difference of less than 30 minutes are considered as end of the trajectories. In other areas, the threshold is set to 60 minutes. Those areas where the tolerance is higher are the one close to chapas stops or stations, bus terminals, informal markets etc. Once all the locations have been assigned to either a trajectory or a stopping point, the dataset results in a set of trajectories evolving over time and space.
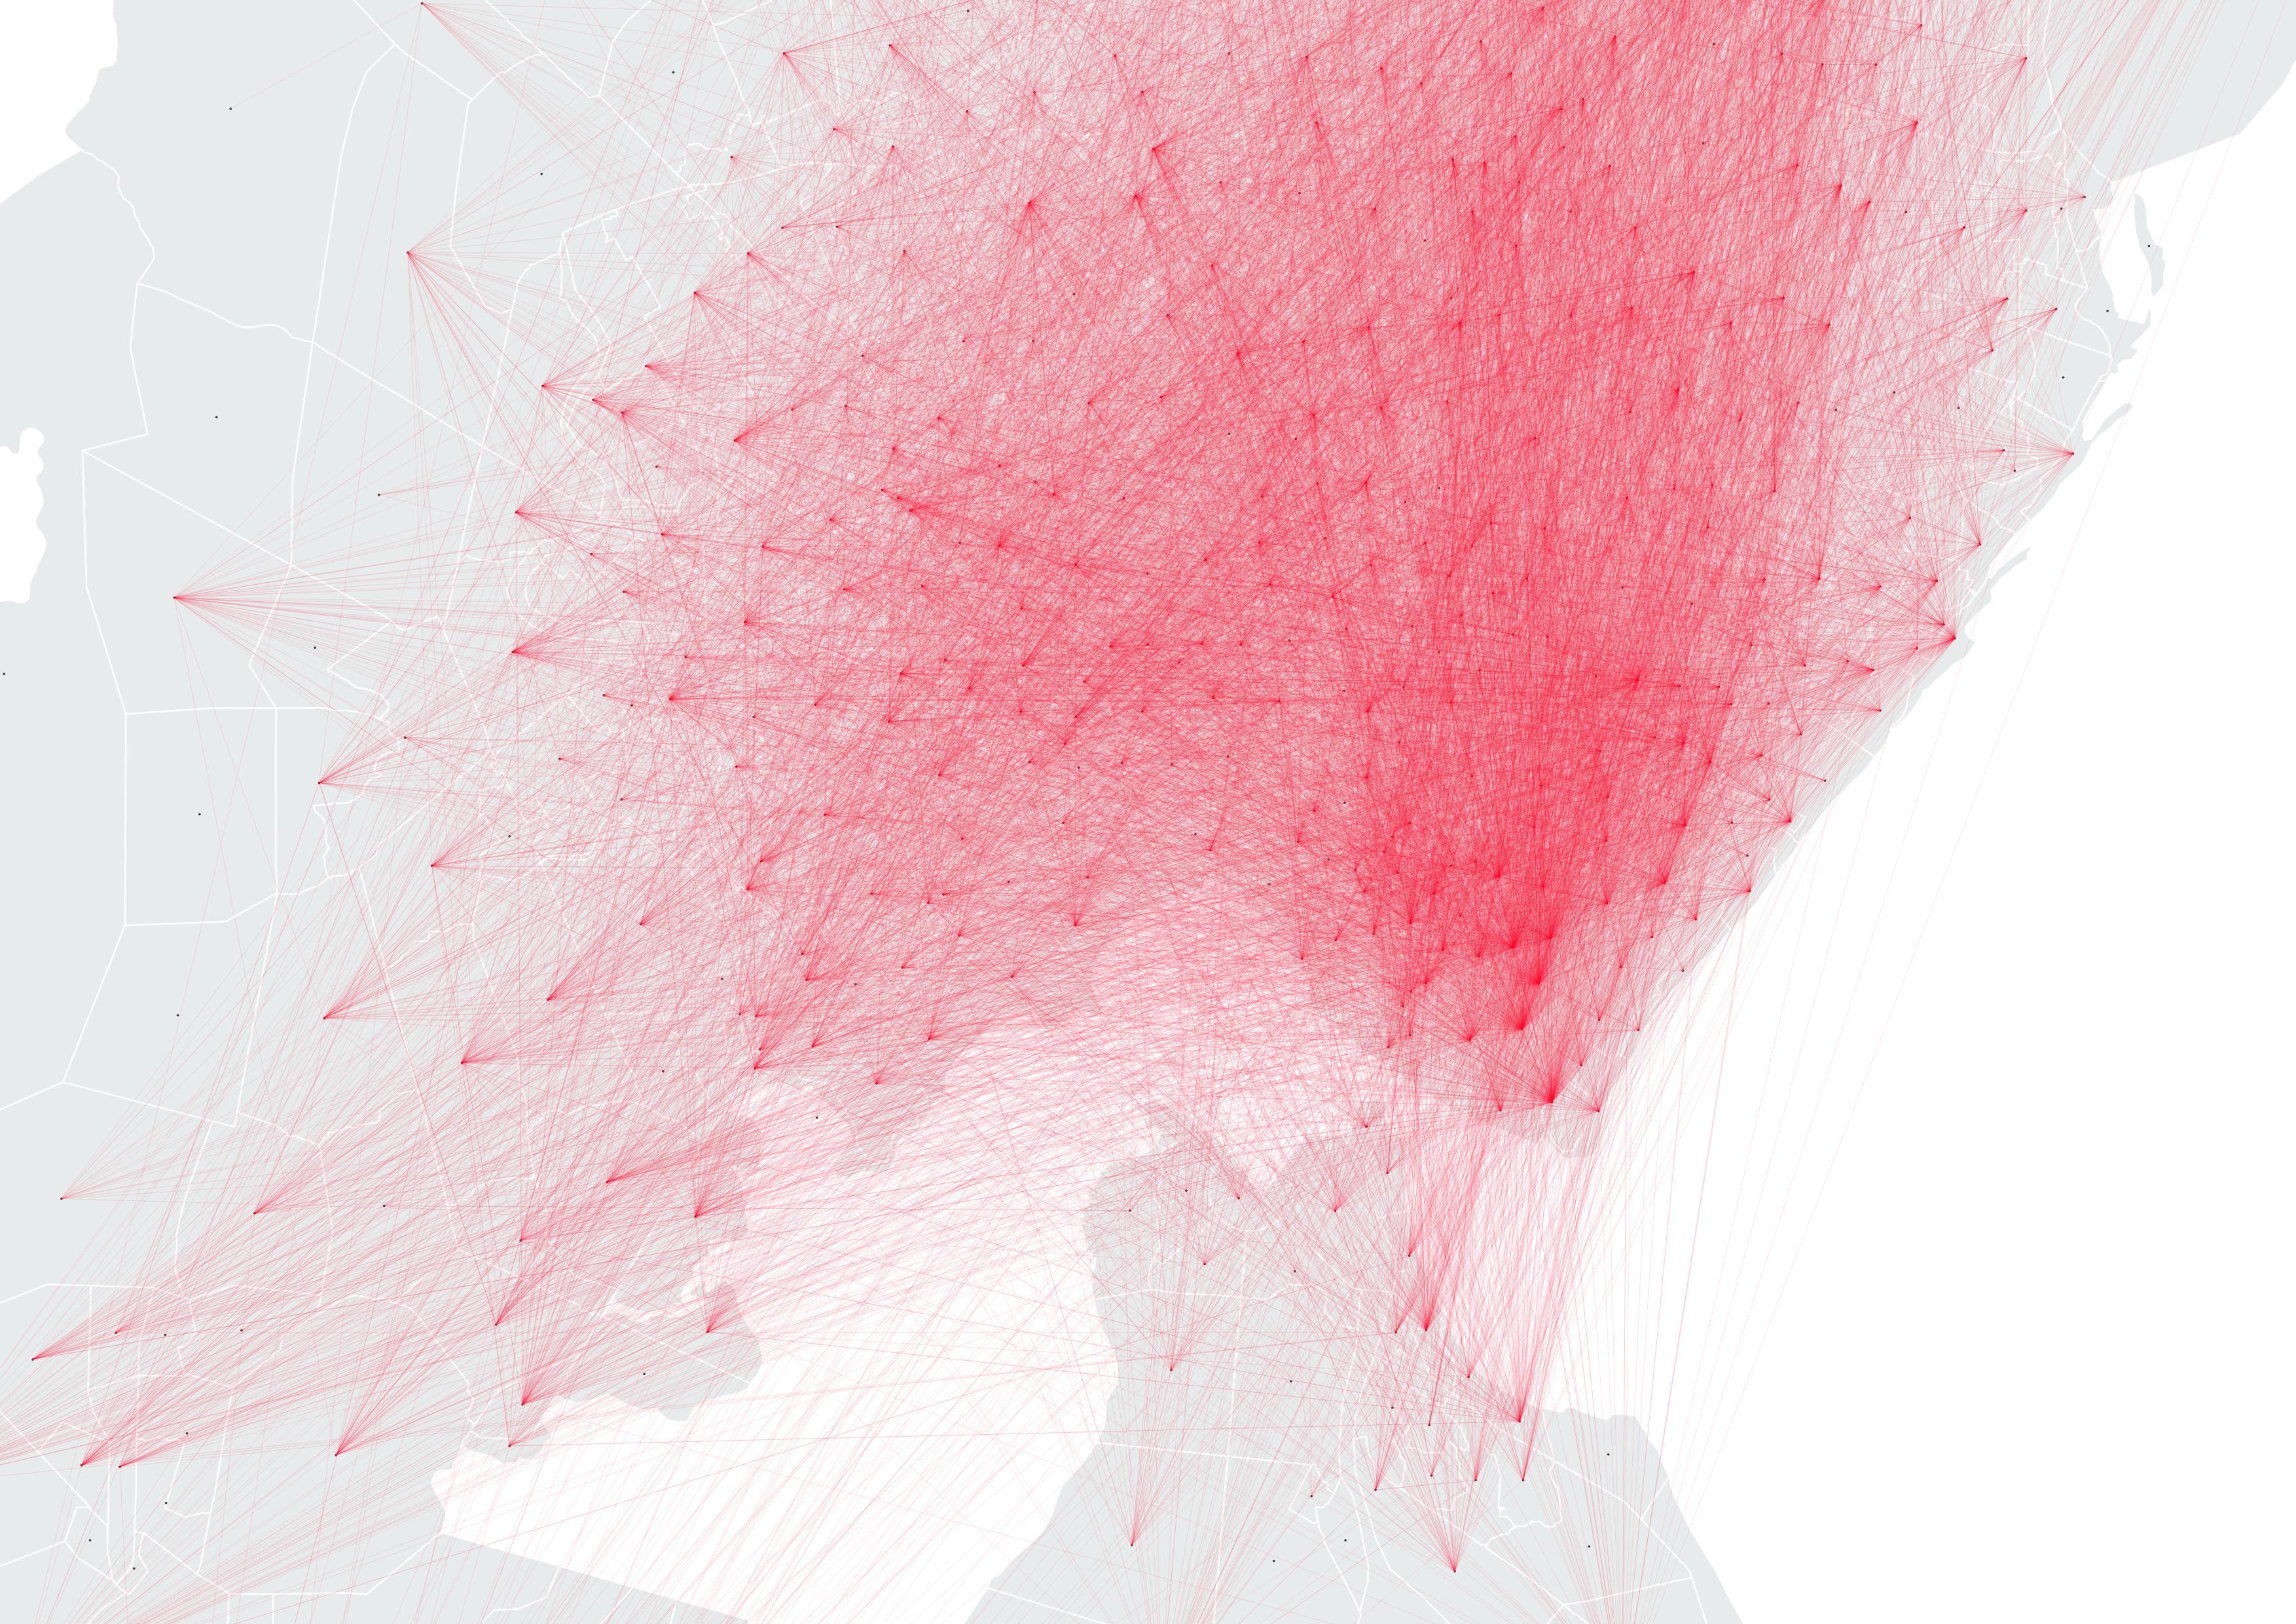
Origin-Destination Matrices Building
Given a set of trajectories obtained preprocessing GPS traces, we aggregate them into hourly origin-destination matrices. The Maputo Metropolitan Area has been divided into the morphological areas described in Accessibility, equity and social exclusion. The origin-destination matrices are networks where every node is a morphological area and every edge between two areas count the number of trajectories starting in one area and ending in the other area. The edge weight correspond to the number of trajectories leaving the area within a certain hour.