Organizing a Mapathon: first-hand experience of the transportation system in Maputo
A small mapathon was organized by Safari researchers to have a first-hand experience of the mobility systems in the city of Maputo and to associate the method of transportation to the movement of mobility users. During the II Sustainable Mobility Week (Semana da Mobilidade Sustentável da Área Metropolitana de Maputo) organised in September 2019 by Agência Metropolitana de Transporte de Maputo (AMT), a team of Safari researchers explored the city with formal and paratransit methods of transportations (i.e., machinebombos, taxis, xopelas, private cars, chapas, or by walking), gathering information on the transportation mode through a simple web app specifically developed by the Safari team to track the transport methods. This resulted in enriching the mobility data already provided by Cuebiq research partner.
Objectives
Beyond offering Safari researchers a first-hand experience of the mobility systems in the city of Maputo and supporting the association of the method of transportation to the movement of mobility users, this small mapathon allowed the definition of a methodological framework to be replicated by other participants on larger scale. Developing a simple web app specifically helped in collecting data in a simple format, but also highlighted the limits of the use of web technologies that often inhibit geolocation of mobile devices for prolonged online sessions. Avoiding the use of web technologies could improve this aspect of the data gathering, and would make it more robust.
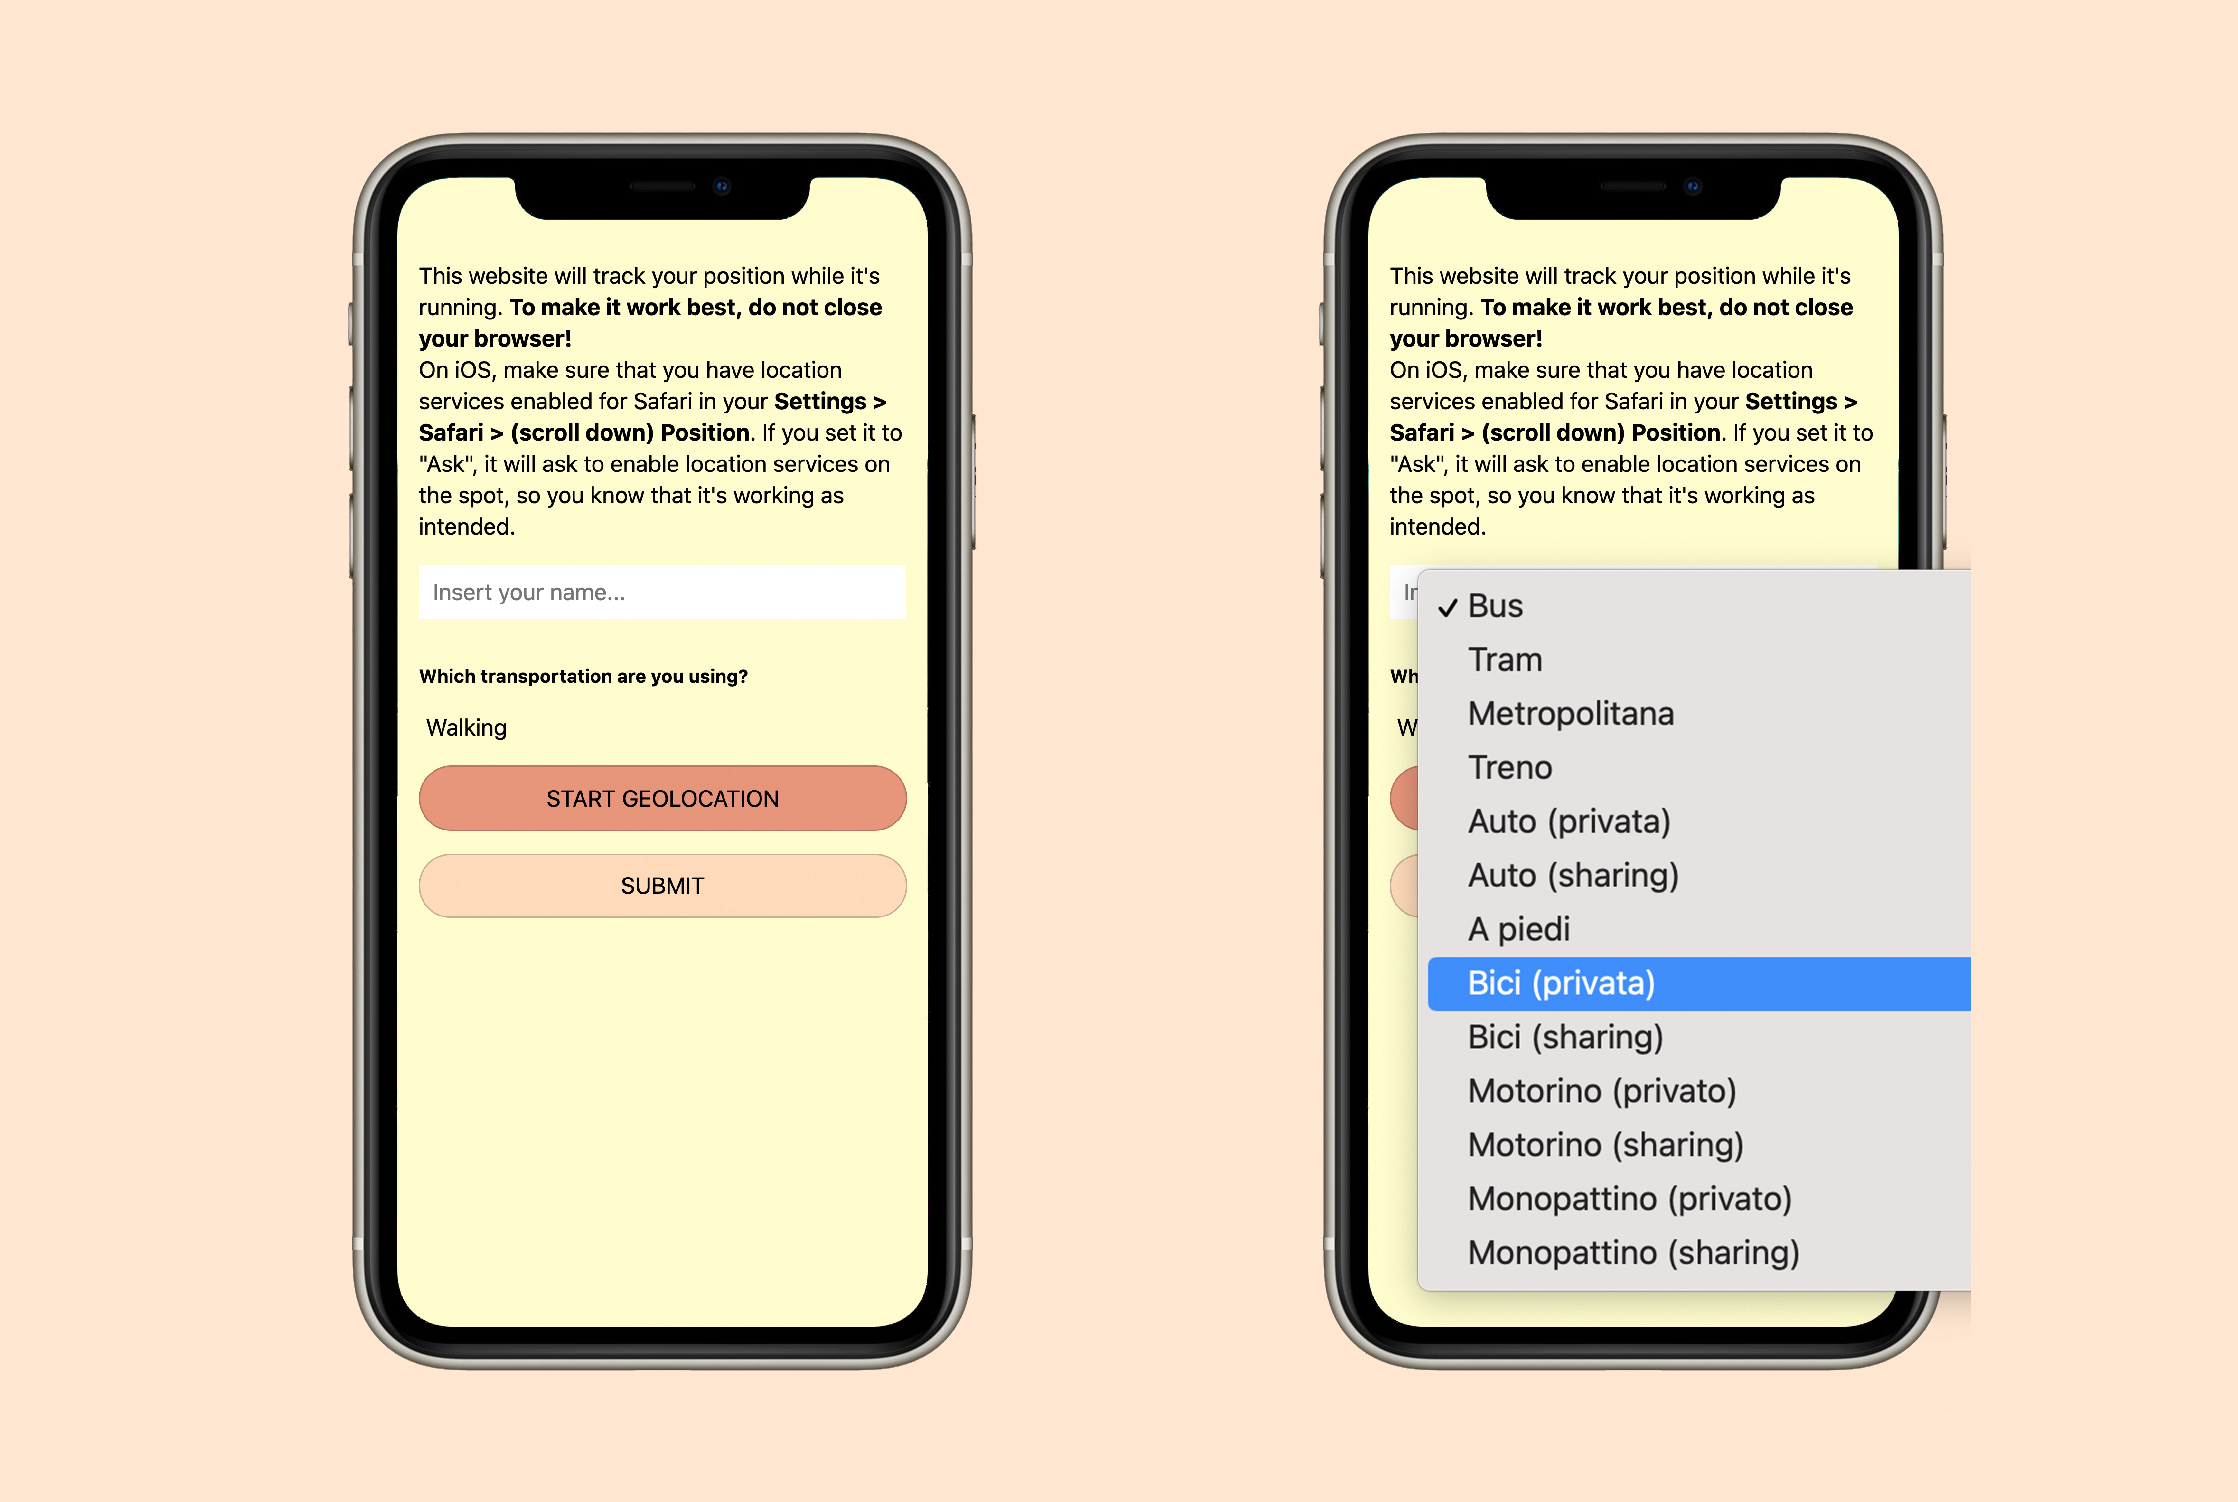 Screenshot of the landing page of the online web application designed for the Mapathon.
Research Activities
Mapathon
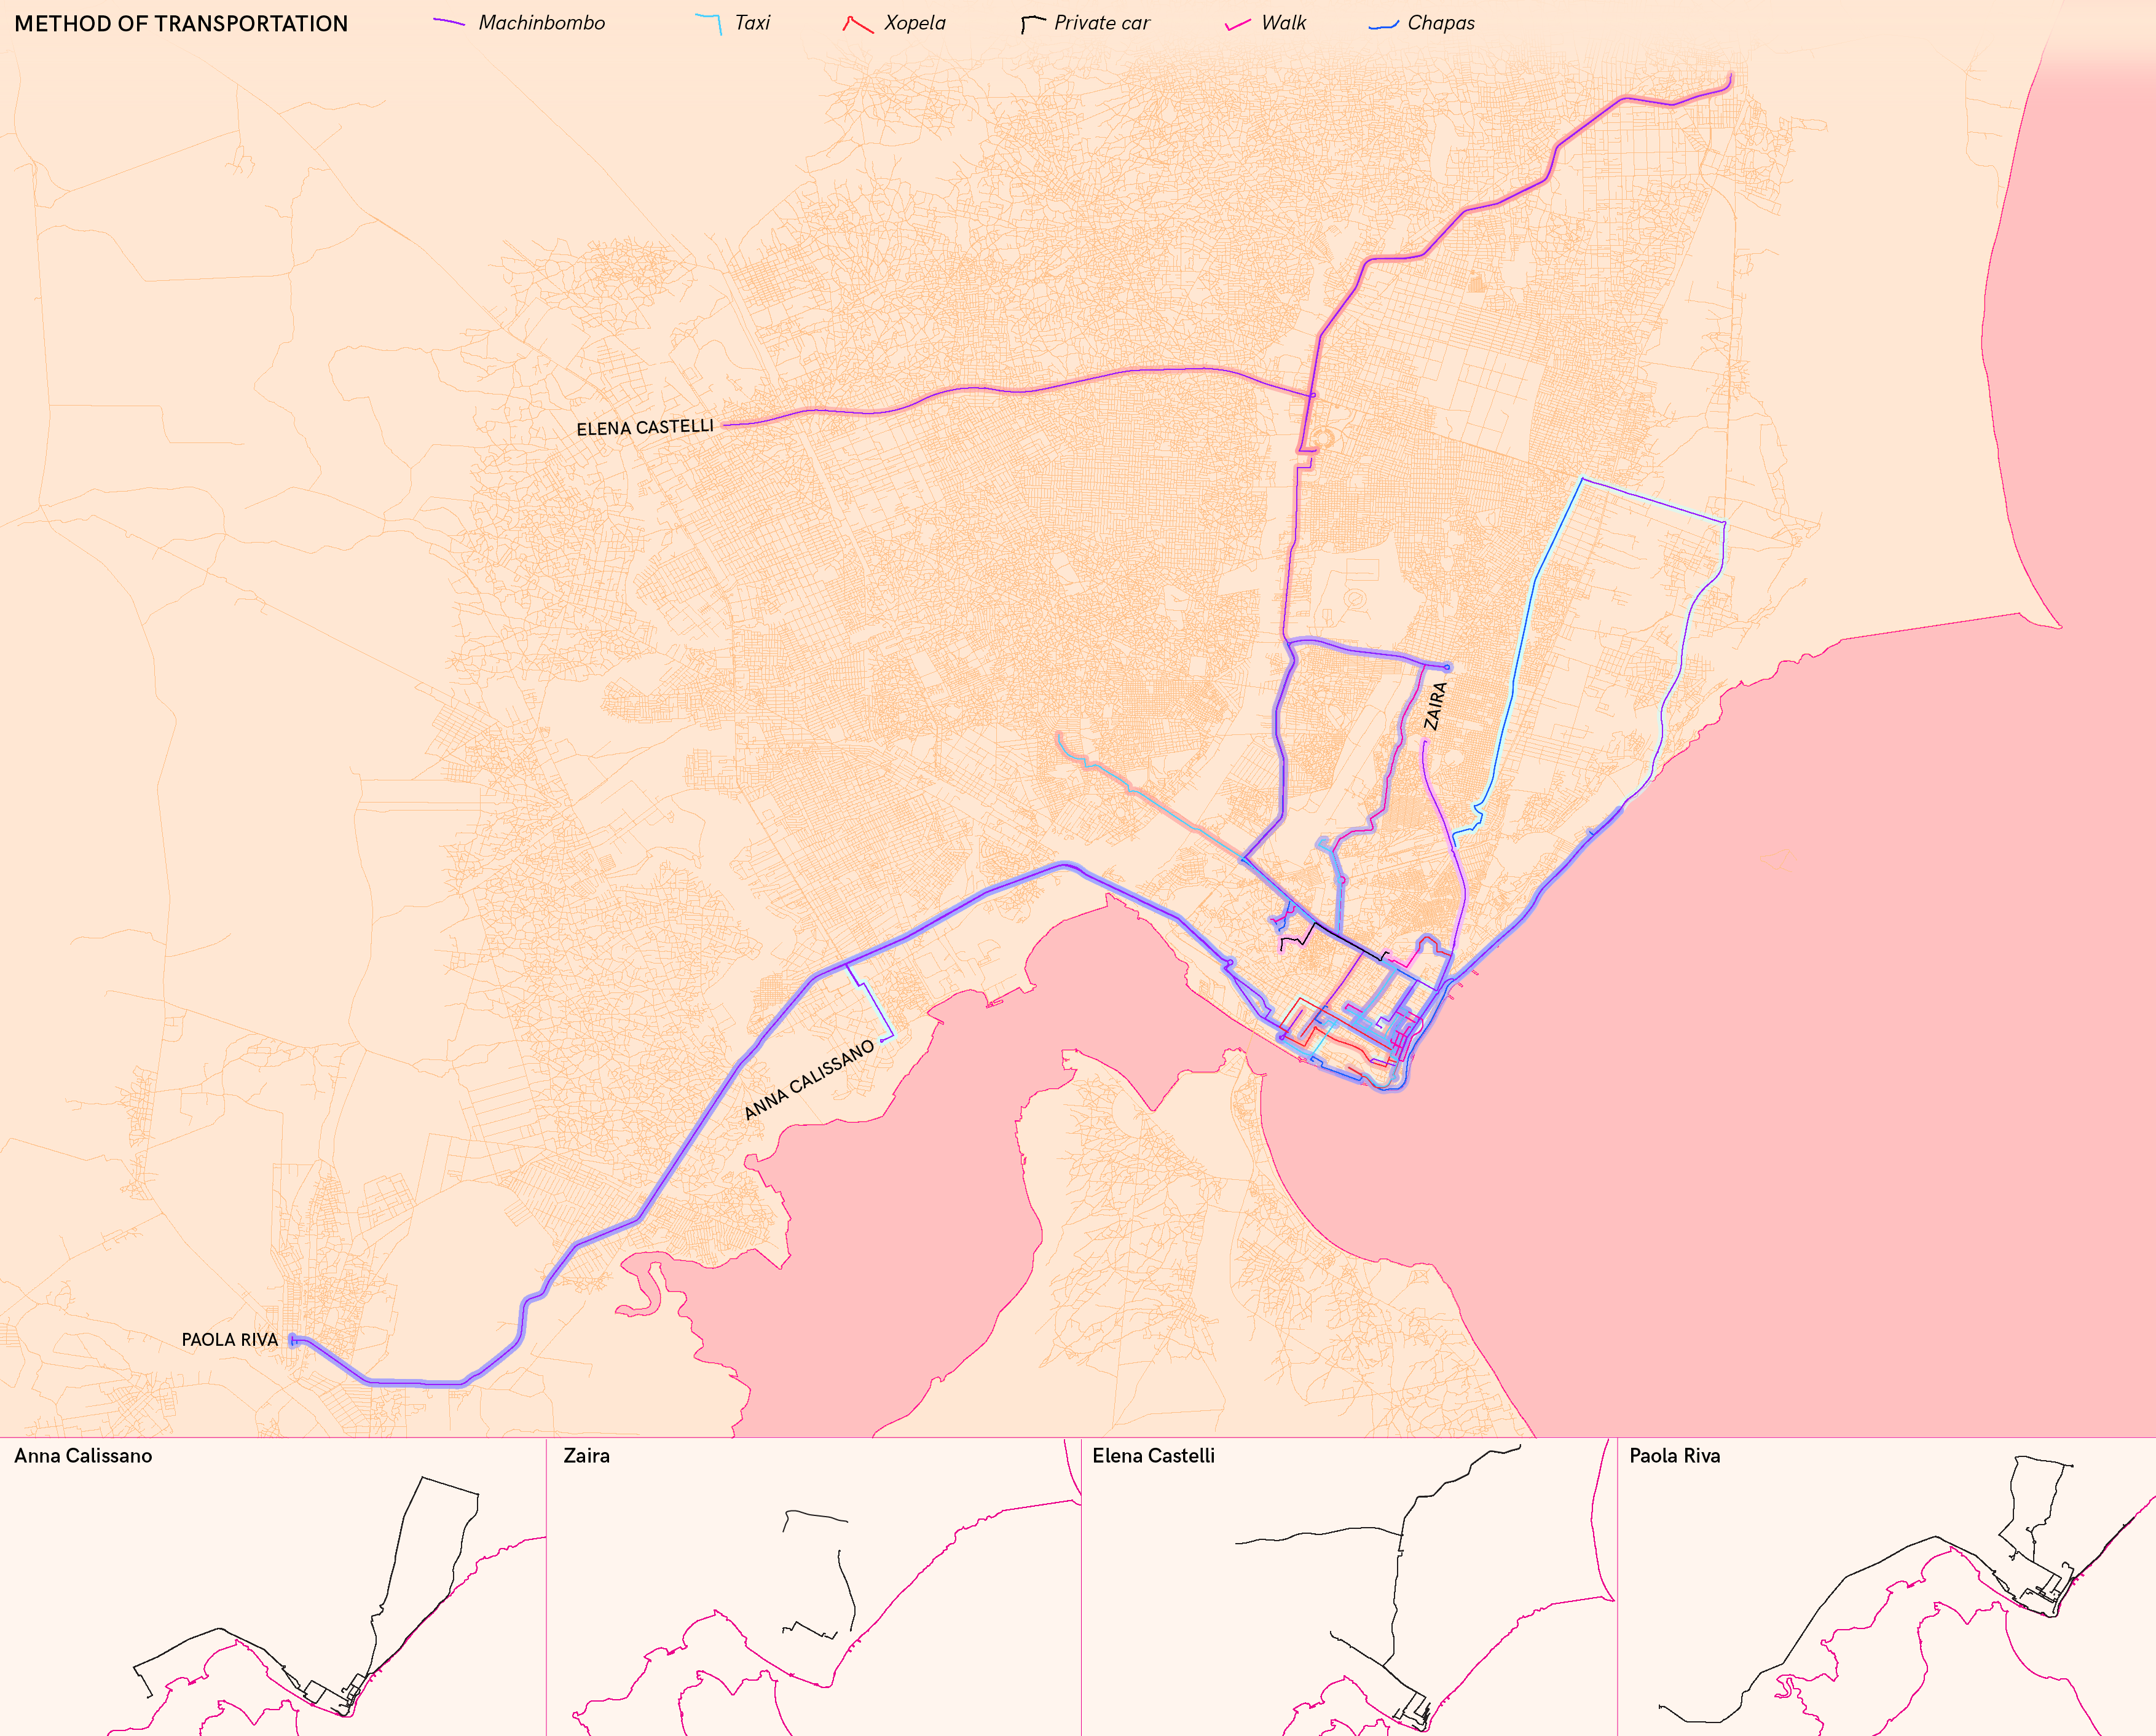
Mapathon participants explored the city using five different transportation methods: machinbombo, taxi, xopela, private car, chapas and walking. Upon starting and ending a trip on a specific transportation, participants logged their position and selected the transportation through a web app developed by the Safari research team. This allowed to have precise starting and ending point for the trip and to associate the transportation method to each trip. The starting locations of each participant for each trip were then interpolated with GPS data to infer the trip inside the city and have been categorized by transportation method and by participant who initiated the trip1.
-
Trips covered during the whole week for each participant are shown in the small maps. ↩